Useful Visualizations
You have got high quality data. Now useful and rich visualizations are key interpreting results.
To get really useful visualizations for bioomedical scientific data is a challenge because:
-
It is needed that the designers and the developers understand the data, and for that it is required actual biological / biomedical knowledge
-
To know and understand your goals is also needed
-
It is required an updated knowledge of the state of the art regarding visualization technologies, libraries, solutions, etc.
-
There are very specialized visualizations as, for example, genome browsers or 3D protein structure viewers that require a very specialized knowledge from the scientific biological side and from the informatics technical side
-
In many projects the integration of different kind of data and the possibility to navigate between different visualizations in an integrated environment is crucial
-
In some cases filtering large datasets to be visualized in real time and quick updating the changing data can be a challenge
Bellow, you can find some examples of very specialized visualizations
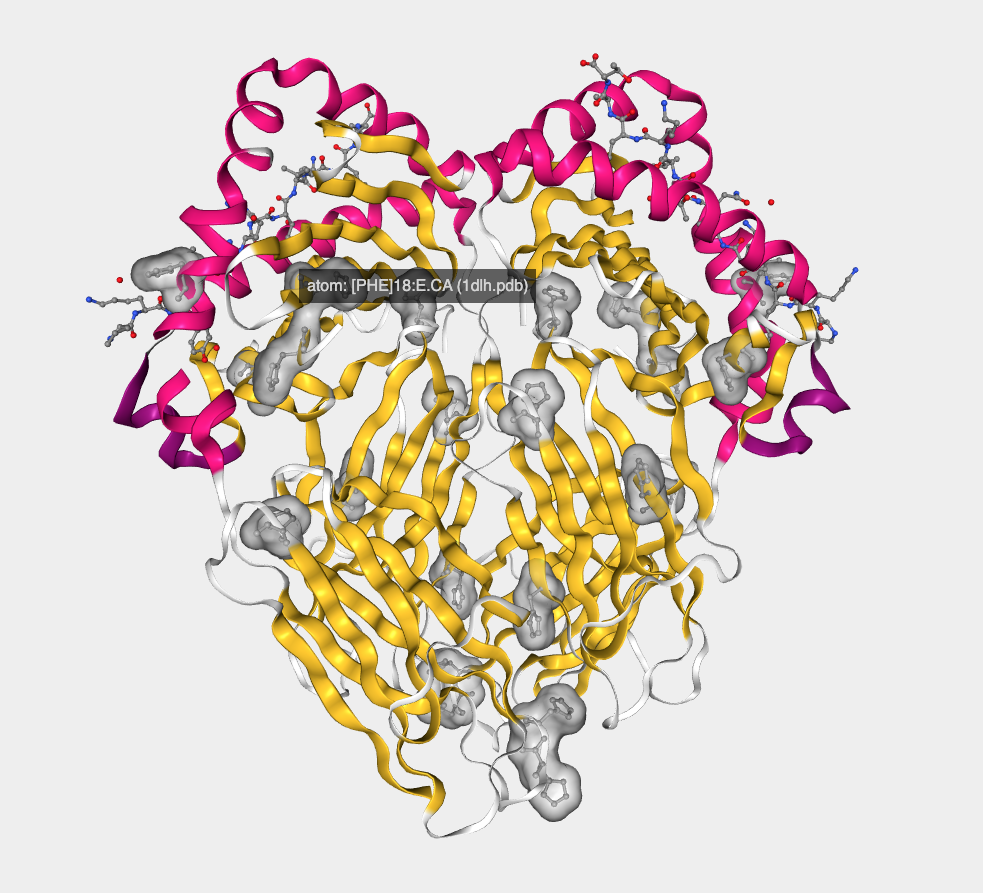
A screen capture of an interactive visualization of a protein 3D-structure in which some key residues have been highlighted
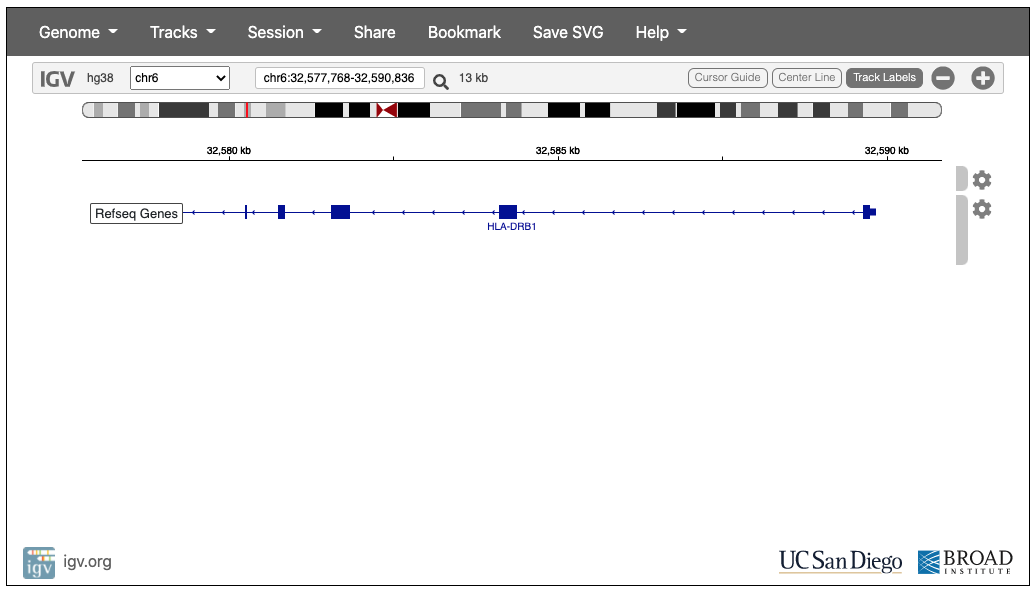
A screen capture of a web based genome browser (IGV) launched at a specific gene: HLA-DRB1
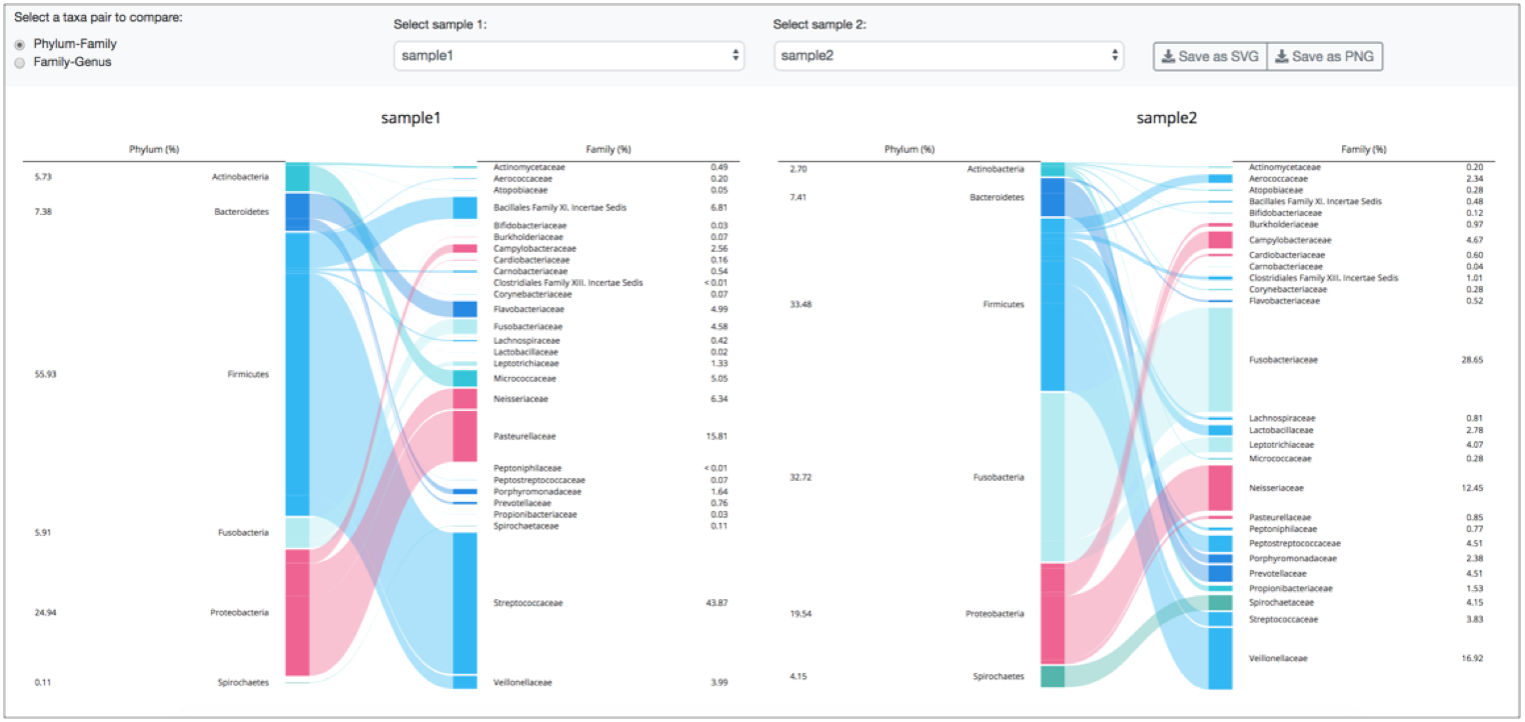
A screen capture of a useful and interactive visualization of microbiome results